Services For Real Estate and Private Equity Insurance

Comparison chart for two Austin ABC property investments by Higginbotham, showing details such as street address, city, year built, build type, occupancy, units, stories, square footage, building and commercial figures, costs, liability, and premiums.
Insurance Benchmark For A Single Property
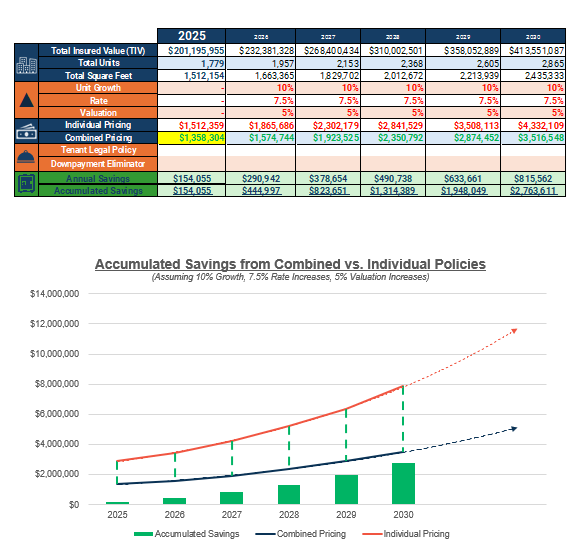
Financial table with data on rental income and savings from 2025 to 2030. Key metrics include total insured value, total units, unit growth, rate, valuation, individual and combined pricing, tenant legal policy, downpayment, annual savings, and accumulated savings. A line and bar graph illustrates accumulated savings and combined pricing growth over the years.
Master Insurance Program Benchmark for Portfolio of Properties
Chart showing the total cost of risk (TCOR) with PE FIRM at $3,094,790, Higginbotham's Renewed TCOR at $1,022,729, and ERM Program's YTD Reduction on TCOR at $355,460 or 12%. Pie chart depicting portfolio spend distributions: ABC Plant Rentals, $135,401; ABC Infrastructure, $1,020,030; ABC Banking, $29,504; ABC Medical Technology, $440,927; ABC Oil and Gas, $916,630; ABC Equipment, $523,305; PE FIRM, $28,993.
Creating Master Insurance Program for Private Equity Group

Significant Savings. Lender Liaison. Verified Value.